
Too Many Requests from Your Network
Please complete verification to access this content.
Growing your list is crucial for any business online. You are the one who is in control of your email list.
Think about Google penalties or a sudden shutdown of a social network; you simply don’t want to only depend on these traffic sources.
You can add one newsletter signup box to your website and wait to see how many email addresses you collect in a given month.
Or you can use your data to really understand your visitors and learn how to optimize your list building efforts.
As you might guess, I recommend everyone to go for the second option!
In this post I will show the exact steps you need to take to set up Google Web Analytics for greater insights on list building and how to optimize it accordingly.
The approach that I take will minimize the technical coding required.
I assume that you understand and done with the setting up of your Google Analytics code.
Table of Contents
- Measurement Plan
- URL Structure
- Single vs Double Opt In
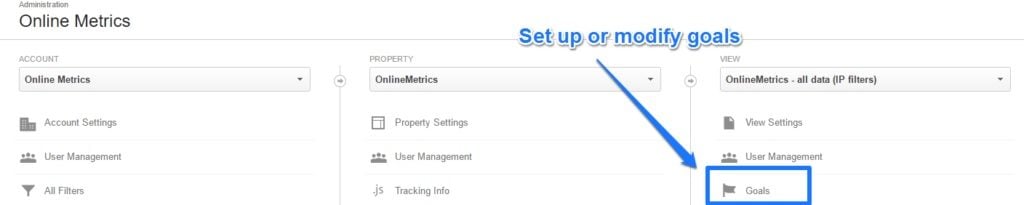
- Set Up Your Goals
- Google Analytics Report Insights
- Concluding Thoughts
Measurement Plan
The very first thing you need to do, is to create a measurement plan.
And specifically aimed at tracking your email signups in the right way.
To keep things easy, start with answering two questions:
- What type of opt ins will you implement (general opt-in, featured opt in box, leadmagnets)?
- Do you use a single or double opt in to collect email subscribers?
This will help you with structuring your pages in a way that measuring them is a breeze.
URL Structure
You can work out a suitable url structure once you have your measurement plan in place.
Let’s assume you are the owner of a running website (www.iloverunning.com) and have these opt ins on your website:
- One general newsletter opt in (side bar)
- One feature opt in box (on top of all pages)
- One content upgrade (5K running plan)
In addition you choose to use a single opt in strategy.
Here is a good URL structure to map out the opt ins on your website.
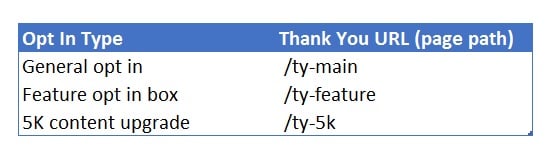
- Page path = “/ty-main” -> URL = “www.iloverunning.com/ty-main”
- “ty” is abbreviation for “thank you”
- All “thank you” pages start with “/ty-“
- The second part (“main”, “feature” and “5k”) clearly refers to the opt in type
It’s a must to get this right at the start.
This will make you live a lot easier when you set up Google Analytics goals later on.
At the same time it’s a great help in optimizing your list building efforts.
Single vs Double Opt In
Things get a bit more complicated when you use a double opt in (like I do).
In this case you want to come up with two separate pages for each opt in. The process might look like:
- Visitor x fills in your opt in form and is redirected to an “almost there” page.
- Visitor x receives an email and has to click a link to confirm their subscription.
- Visitor x is sent to your “thank you” page.
There are many different ways you can structure this, but the one described above works very well in my case.
And the measurement part is not too hard.
Here is an example of how you could structure this for your feature opt in box:
- “Almost there” page: “/almost-feature”
- “Thank you” page: “/ty-feature”
The key here is to use a structure and naming conventions that you can replicate for all different opt ins.
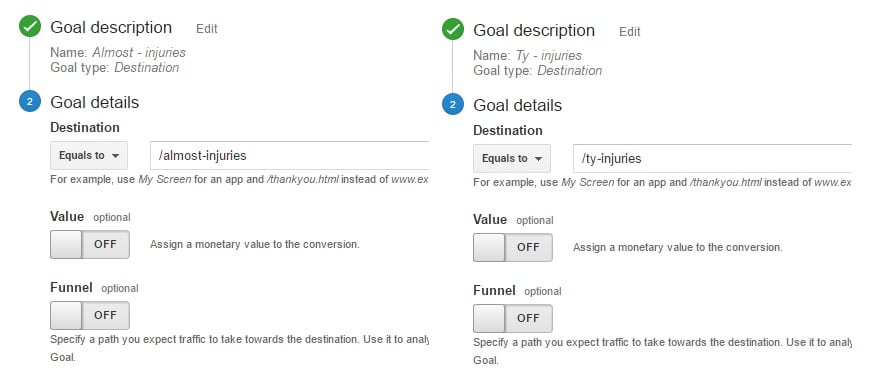
Later on you might want to add another content upgrade for “running injuries”:
- “Almost there” page: “/almost-injuries”
- “Thank you” page: “/ty-injuries”
It’s all about staying consistent over time!
Set Up Your Goals
The next phase is setting up your goals in Google Analytics in the correct way.
I will use the last example (content upgrade = injuries) for a double opt in situation.
Before we move on I will shortly touch upon the way Google Analytics is structured:
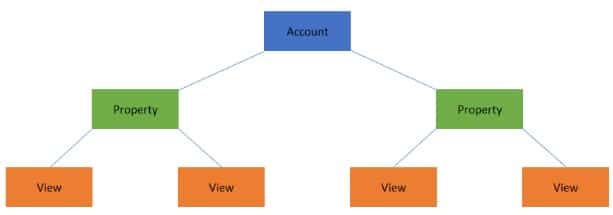
One Google Analytics account can contain one or more properties. And each property can have one or more views.
Goals are set up at the view level of a property.
You need to have “edit” permission rights to be able to set up goals.
This is a list of things you need to do:
- Set up two goals: “/almost-injuries” and “/ty-injuries”
- Set up two goal values for each of them
1. Set up Two Goals
Like I mentioned before, a double opt in structure is more complex than a single opt in one.
The reason why is that a Google Analytics session expires after 30 minutes.
This means that an issue occurs when a visitor that subscribes to your newsletter clicks the email confirmation link after more than 30 minutes of inactivity.
In this case:
- The conversion is incorrectly attributed to direct traffic.
- The landing page that get’s credited for the conversion is the “thank you” page itself.
- Other Google Analytics reports show inaccurate or less optimal results as well.
You don’t want to only depend on your “thank you” page conversion data in this case.
And a solution is to set up two goals:
This will ensure you have a complete overview of how your website performs in terms of converting visitors to a subscriber.
A couple of things to keep in mind:
- Goals don’t work retroactively.
- You can set up 20 goals per view.
- If you have dozens of content upgrades you might want to work with aggregated goals instead of individual ones.
- For aggregated goal conversion rates you need to fill in “begins with” /almost and “begins with” /ty.
- Setting up goal values can deliver tremendous additional insights on your performance.
2. Set up Goal Values
Goal values are very valuable for both ecommerce as well as non-ecommerce sites.
Ecommerce sites can use them in addition to non-transactional goals on their website.
Non-ecommerce sites must use them to define values for micro and macro conversions on their website.
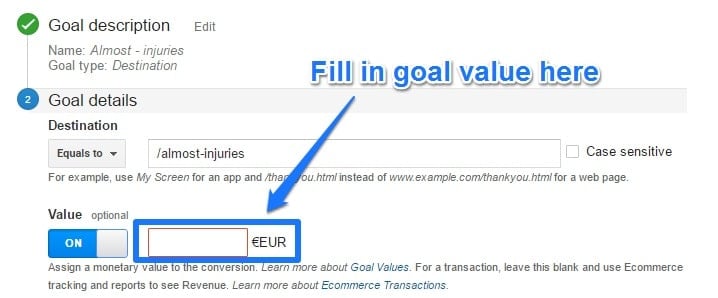
Here is an example:
www.iloverunning.com: 2000 subscribers are worth 50.000 revenue in a year.
The revenue per subscriber (on a yearly basis) equals 25. So the goal value of a new subscriber is 25 (calculated with Lifetime Value of one year).
Note: if you know that 20% drops off from the pre-confirmation page, you want to set up a goal value of 20 instead of 25 for this goal.
You could go for an average goal value for the different opt ins on your site or calculate them per opt in.
I recommend to start out easy with an average goal value and move toward individual goal values once you get comfortable with using them.
Google Analytics Report Insights
Here are five reports I recommend to check out once you’ve got the set up right and have collected a decent amount of data.
1. Channel Performance
You can find this report via Acquisition >> All Traffic >> Channels
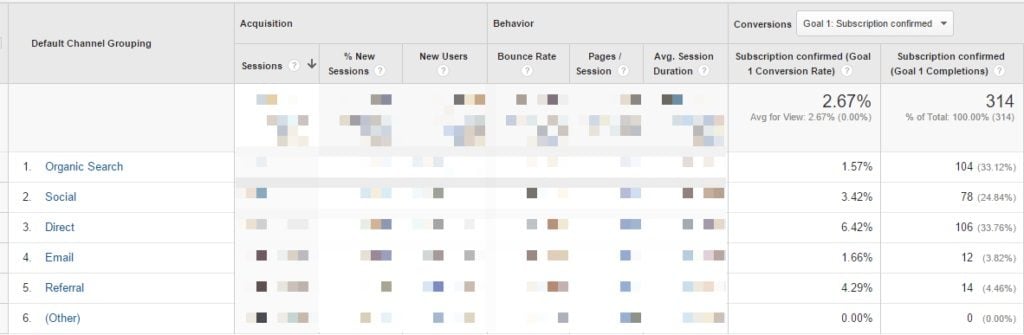
You will get a good understanding of how well each of your channels performs in relation to your conversion goal (newsletter subscription).
Questions you can answer:
- Does Social have a significant influence on growing my subscriber base? Do I need to invest more time and effort in this channel?
- What is the relative contribution of organic search and is it stable, growing or declining?
- How well do people that are already known for my brand (direct traffic) convert?
I recommend using the “Channel Grouping” report instead of “Source/Medium” report.
The channels give a more accurate overview of the performance.
If someone visits your website via Facebook, the session is registered under medium “referral”.
This causes the data of the “Source/Medium” report to be inaccurate.
Secondary dimensions come in handy when you want to get a more detailed overview of the performance of one channel.
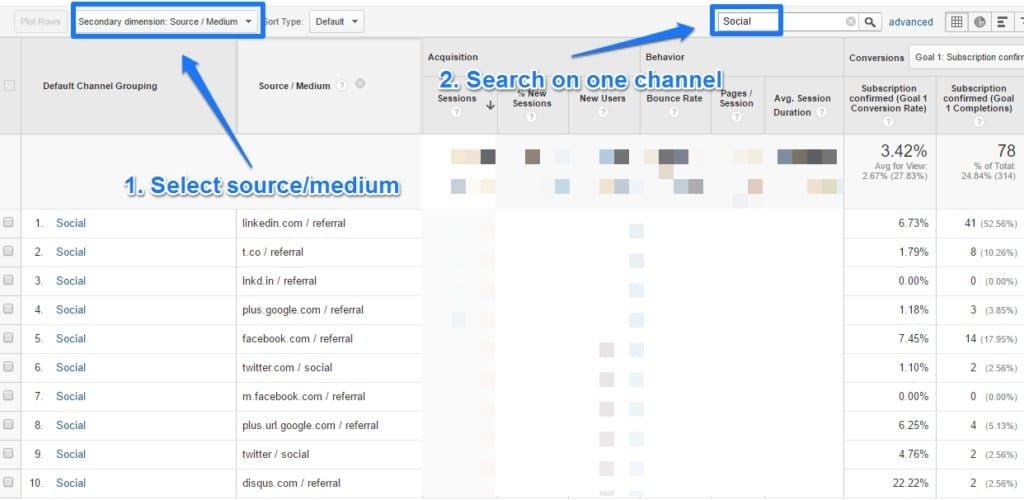
These secondary dimensions are a powerful way to segment your conversion for greater insights.
You not only know which channel performs well, but also which network.
It helps you to optimize your list building efforts in a much better way.
2. Organic Performance
For a lot of companies organic search is one the most important channels to drive their newsletter subscriber base.
The new Search Console report (currently in beta) delivers great insights in addition to the aggregated channel overview report.
You can find this report via Acquisition >> Search Console >> Landing Pages
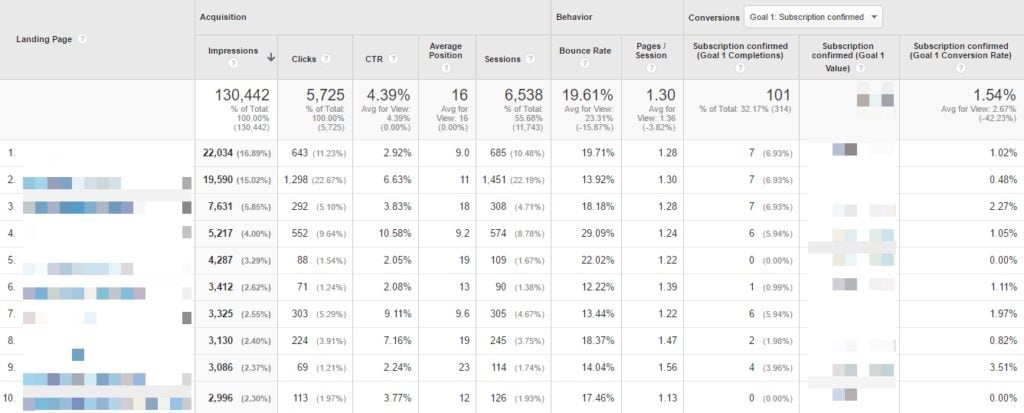
In the past Google Analytics showed you the exact search queries, but not anymore.
They show up as (not provided) in the organic search report.
However, landing page performance is closely tied to keyword performance.
You usually optimize your landing page for a particular key phrase.
This makes the organic landing page performance report extremely powerful.
Here are a couple of insights (before acting you need to have more conversions first):
- Landing page three: average position = 18, subscriber conversion rate = 2,3%. This is above average. Invest extra efforts to get this page to rank on the first page?
- Landing page nine: average position = 23, subscriber conversion rate = 3,5%. This is far above average. Invest extra efforts to get this page to rank on the first page?
- Landing page two: the highest number of clicks, but a very low subscriber conversion rate (0,5%). Adding a specific content upgrade on this page might boost the subscriber conversion rate.
- Landing page four: CTR > 10% (very high!), subscriber conversion rate = 1,1%. This is below average. Adding a specific content upgrade on this page might boost the subscriber conversion rate here.
Taking a well-segmented approach will greater enhance your understanding of what is going well and where you need to improve.
3. User Type Performance
Often you get one chance to convert a visitor into a subscriber.
Someone lands on your site via a search query, reads your article (if you are lucky) and moves on.
You want to capture their email address on the first visit.
It’s important to understand how your new visitors behave compared to returning visitors.
This report can be found at Audience >> Behavior >> Overview
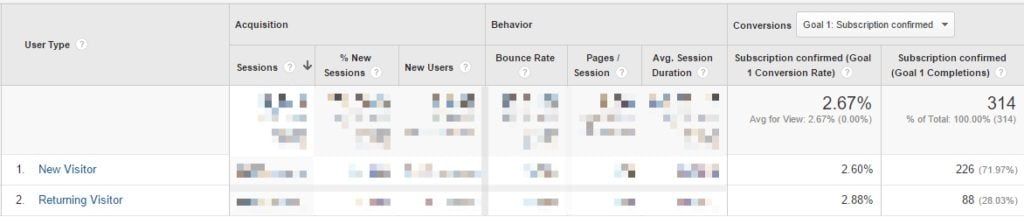
This website owner is doing a great job. The conversion rate of a new visitor is within the same range as a returning visitor.
You might want to try out a more aggressive approach if there is a large gap between the new and returning visitor conversion rate.
4. Device Performance
Chances are high that your website receives traffic from different device types: desktop, tablet and mobile.
How well do people convert on every device?
That’s when the “device performance” report is very useful to examine.
Go to Audience >> Mobile >> Overview
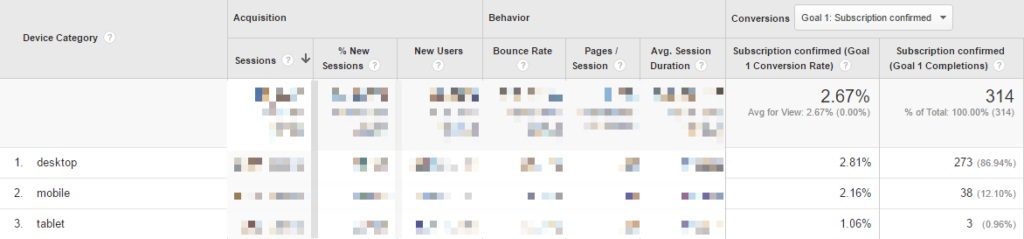
In a minute you have a better understanding of what’s going on:
- Desktop is the most important traffic and conversion driver for this website.
- Tablet is a very small segment compared to both mobile and desktop.
- Performance on mobile is quite good (conversion rate is well above 2%).
In this case I would do some additional research:
- How is the user experience on mobile? Is the website fully mobile optimized?
- How is the search volume in this niche among the different devices? I expect most people to search on desktop based on traffic and conversion stats.
High traffic numbers on mobile and tablet devices and relative low conversion numbers indicate an issue.
You definitely want to solve this issue, because it makes a huge difference for your list growth!
5. Browser Performance
Another report that can be helpful is the browser performance report.
Go to Audience >> Technology >> Browser & OS
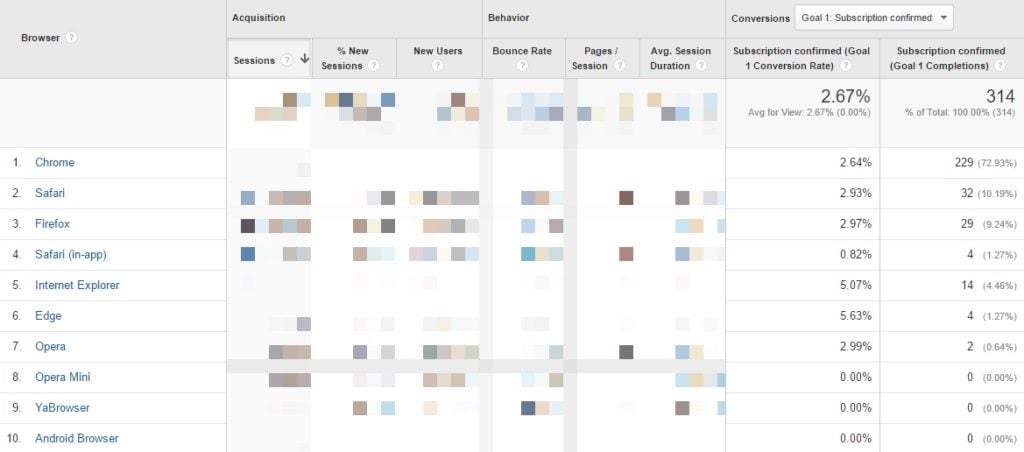
This website receives a ton of conversions via Chrome.
Internet Explorer and Edge are relatively the best performers.
Make sure to check for:
- Underperforming browsers and examine them on a deeper level (browser version).
- Head over to IT if there are compatibility issues.
- Make sure to optimize the experience on the most populair browsers and browser versions first.
I recommend to use BrowserStack or a similar tool if you have to solve any browser issues.
BONUS: Page Values
Conversion rates are great, but monetary values make you want to act.
We earlier discussed about setting up goal values. Please see below what kind of insights you can expect to get:
(Navigate to Behaviour >> Site Content >> All Pages)
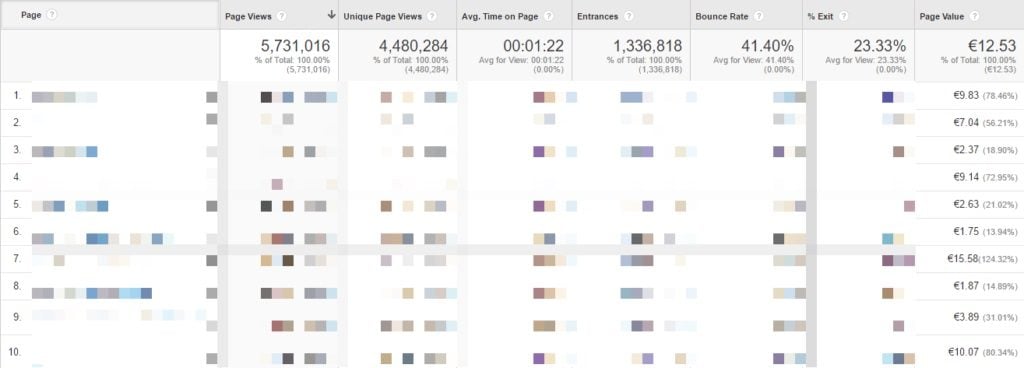
This report goes beyond a simple landing page and attributes a subscriber conversion value to each of your pages.
You can answer question like:
- How are my individual pages contributing in terms of monetary value?
- Which posts (list posts, roundup posts, critique posts) tend to do better than others?
- Which categories trigger more sign ups?
This is just the tip of the iceberg of what is possible with Google Analytics.
You will be ahead of 90% of your competitors if you follow a similar process like the one in this article!
Concluding Thoughts
- Always start with a measurement plan. Map out your website and subscriber conversion points.
- Decide upon using a single or double opt in. This affects the URL structure of your “thank you” pages.
- Come up with a well-defined structure. Naming conventions really come in handy here. I recommend using “/ty-[NAME]” and “/almost-[NAME}” (in case of double opt in).
- Set up goals and goal values for the best Google Analytics insights.
- Collect a sufficient amount of conversions before you start your first analysis and optimization project.
- Cross-segmenting your conversions and optimizing for your most important segments is the key in growing your list.
You will skyrocket your insights and list growth if you measure the right things and optimize the results!
I would love to hear your thoughts. Do you already use Google Analytics to grow your list? If not, start today!
Paul Koks is the founder of Online Metrics and the author of Google Analytics Health Check. Paul helps companies to capture valuable insights from reliable data. You can find him on Twitter or LinkedIn.